COMPARATIVE FINANCIAL STATEMENT:
This is main tool of financial analysis. This type of analysis is useful when the accounting data of two periods is given. Generally two statements are prepared
i) Comparative balance sheet
ii) Comparative income statement
The figures of two periods are taken in their respective columns and increase or decrease after which percentage is taking into account previous year as base year. After showing the increase or decrease the interpretation in form of comment is also to be specified. However the various comparative statements are to be prepared as follow.
i) Comparative balance sheet:-
To analysis the financial statement as per the technique of comparative statement analysis the first one is the comparative balance sheet for preparation comparative balance sheet with following steps
Ist step
Take the given balance sheet of two period in years
2nd step
Make the difference of each item of balance sheet in the vertical or horizontal form determining the increase or decrease ( in absolute figure)
3rd Step
Make the % of increasing or decreasing ( Previous year as base year)
4th step
Interpretation (Comments)
a) Long term financial position
b) Working capital position
c) profitability position
d) Overall financial position
ii) Comparative Income Statements
The income statement shows results of operation of business .The comparative income statement indicate the variation with different item which are to be recorded in income statement .Over a particular period of time that is one year. It shows the amount of gross profit, operating profit and net profit. However a comparative income statement is to be prepared in following form.
Interpretation or Comments can be given
► On the increasing sale or cost of sale increasing or decreasing
► Operating expenses and incomes affecting the amount of profit or loss
► Overall profitability position

COMMON SIZE BALANCE SHEET:
For analysis of common size balance sheet, we take two companies balance sheet. After this, we convert its all figures in the proportion of 100%. For this, we use following simple formula.
= Asset Figure of balance sheet/ Total Assets X 100
or
= Liability Figure of balance sheet/ Total Liabilities X 100
Following is the sample which is used for common size balance sheet analysis.

1st Point of Analysis : Resources of Buying Fixed Assets
This is main tool of financial analysis. This type of analysis is useful when the accounting data of two periods is given. Generally two statements are prepared
i) Comparative balance sheet
ii) Comparative income statement
The figures of two periods are taken in their respective columns and increase or decrease after which percentage is taking into account previous year as base year. After showing the increase or decrease the interpretation in form of comment is also to be specified. However the various comparative statements are to be prepared as follow.
i) Comparative balance sheet:-
To analysis the financial statement as per the technique of comparative statement analysis the first one is the comparative balance sheet for preparation comparative balance sheet with following steps
Ist step
Take the given balance sheet of two period in years
2nd step
Make the difference of each item of balance sheet in the vertical or horizontal form determining the increase or decrease ( in absolute figure)
3rd Step
Make the % of increasing or decreasing ( Previous year as base year)
4th step
Interpretation (Comments)
a) Long term financial position
b) Working capital position
c) profitability position
d) Overall financial position
ii) Comparative Income Statements
The income statement shows results of operation of business .The comparative income statement indicate the variation with different item which are to be recorded in income statement .Over a particular period of time that is one year. It shows the amount of gross profit, operating profit and net profit. However a comparative income statement is to be prepared in following form.
Interpretation or Comments can be given
► On the increasing sale or cost of sale increasing or decreasing
► Operating expenses and incomes affecting the amount of profit or loss
► Overall profitability position
I am giving the Performa of comparative income statement. With the help of this Performa, you can now easily make this and can estimate your future profit planning .For making this you must need of current year and previous year profit and loss account. After making this you can compare each and every item of your profit and loss account. This account is very useful for all type of managerial decisions. You can see in percentage form in which part of profit and loss account , we decrease our expenses from last year or increasing income from last year. Increasing the expenses does not mean your performance is weak . But some time expenses will increase your profitabilty level
COMPARATIVE BALANCE SHEET:
Comparative balance sheet is the part of financial analysis in management accounting. We can explain the importance of comparative balance sheet in the answer of following questions:
1. # Where did we Use our Fresh Share Capital Fund?
If any company issues new shares and get the fund. This will easily be found by preparing comparative balance sheet. Exact figure, we can find. For example, we had $ 100000 total share capital in 2010 and $ 180000 in 2011. Now, by comparing both share capital, we find that there is 80% increase in our total share capital. But if we compare our fixed assets and suppose increase in fixed assets is 40%. At that time, we did not utilize our share capital for buying new fixed capital. There where did we use our share capital. We can not make our shareholder fool by telling that we still use all share capital money for buying fixed assets because every shareholder may have capacity to appoint CA or CPA or CFA. Company can never speak white lie. So, management of company will be responsible for balance 40% use. Next part of comparative balance sheet may give answer above question.
2# Why is Current Liabilities are more than Current Assets?
If our comparative balance sheet shows net increase in current liabilities is 300% and net increase in current assets is 100%. Difference of this will negative increase in working capital. Let me simplify this. It means liabilities have increased by 300% but we have not capacity to pay just 100% current liabilities with our current assets. Next 200% current liabilities will not get anything via cash without liquidation. So, management has to concentration on this point.
3. # Where did we use our Long Term Debt?
Sometime company gets long term debt for different needs. If we compare long term debt of 2010 and 2011 and suppose, we find that it also increase 100% and assets side, we see 200% increase of profit and loss account's debit balance. At that time, total picture of company may be clear. Company is using his share fund and long term funds in very very bad projects in which its capital and debt is sunken. So, company is increasing debt and same debt is using for covering loss but loss is still increasing fast for consuming company's debt and capital. This is worst situation of company.
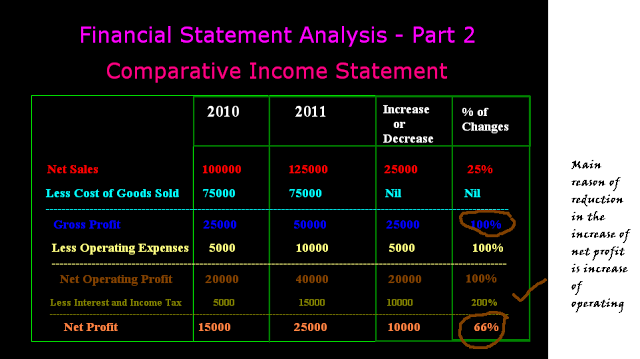
Comparative income statement is the part of financial statement analysis. This statement is made for analysis of company's revenue position. For making this statement, we take two years income statement. We compare its all figures. By comparing its all figures, we find increase or decrease in its all items. After this, we calculate % of increase or decrease by taking previous year as base year. It means, we divide increase or decrease figure by previous year figure. Following is the example of comparative Income statement.
We can explain and analyze of above statement with following way:
From above net sales figures, we find that our net sale has been increase by 25% but this is not sign of our revenue progress. We have to still check our cost of goods sold increase, operating expenses increase and non-operating expenses increase. From above comparative income statement, we find that we have succeeded just control our cost of goods sold but our operating and non-operating expenses has increased 100% and 200% respectively. Due to this 100% increase in gross profit has decreased up to 66% increase in net profit. 66% is also sufficient increase in net profit for retaining and distribution of dividend to our shareholders on their share capital.
Important Points for Management Accountant to Analyze Comparative Income Statement
1 # Net Profit should also analyze whether it is giving perfect return on investment. See, what was last year our return on investment and what is current year our return?
2. # Management accountant should also analyze all resources' cost with its turnover. See, what were last year our total resources' cost and revenue and what are current year total resources' cost and revenue?
For analysis of common size balance sheet, we take two companies balance sheet. After this, we convert its all figures in the proportion of 100%. For this, we use following simple formula.
= Asset Figure of balance sheet/ Total Assets X 100
or
= Liability Figure of balance sheet/ Total Liabilities X 100
Following is the sample which is used for common size balance sheet analysis.
1st Point of Analysis : Resources of Buying Fixed Assets
When both company's balance sheet will convert in the proportion of 100. It becomes easy to analyze it. We can see that A Ltd company has fixed asset which is 95% of its total assets but its share capital is 75% of total liabilities. It means for buying 20% more fixed assets, it has used long term loan. This is not good, if company has to pay high rate of interest and return on fixed asset is less because company will have to pay same fixed interest on loan. When we see the balance sheet of B Ltd company, we find that 60% of share capital is used for buying 60% fixed assets. This position is good because company is using its own capital without paying fixed interest to loan holders.
2nd Point of Analysis : Working Capital
Working capital position of B Ltd is better than A Ltd because in B Ltd, there is 10% excess of current assets over current liabilities which can easily use for paying current liabilities and other day to day expenses. But working capital position of A Ltd is not good because company has no working capital.
3rd Point of Analysis : Current Assets
When we go to the detail of current assets, we will check which company is using its fund for which current assets. For example B company's 40% current assets in inventory. That is not good current position because we need some cash for payment of expenses. It is not necessary, we will able to sell all our inventory in one day. Moreover, we will not get interest on over-stocking. It will only increase our cost of rent of storage.
4th Point of Analysis : Rule of Thumb
Time to time accounting and finance experts make some rule of thumb. If both balance sheet in the % form, we can analyze on the basis of rule of thumb. For example, suppose 65% of total assets should be in fixed form. Now, we see B Ltd is good because it is near to rule of thumb.
COMMON SIZE INCOME STATEMENT:
Common Size Income Statement
| A Ltd ( in 000) | A Ltd (%) | B Ltd ( in 000) | B Ltd ( %) | |
| Sales | 500 | 100 | 700 | 100 |
| Less Cost of Sales | 325 | 65 | 510 | 72.86 |
| Gross profit | 175 | 35 | 190 | 27.16 |
| Operating Expenses | ||||
| Office Expenses | 20 | 4 | 25 | 3.58 |
| selling expenses | 30 | 6 | 45 | 6.42 |
| Less Total operating expenses | 50 | 10 | 70 | 10 |
| Operating Profit | 125 | 25 | 120 | 17.14 |
| Add Miscellaneous Income | 20 | 4 | 15 | 2.14 |
| Total Income | 145 | 29 | 135 | 19.28 |
| Less Non operating Income | ||||
| Interest | 25 | 5 | 30 | 4.28 |
| Net Profit | 120 | 24 | 105 | 15 |
In above table, we have made common size income statement by taking profit and loss account data of A Ltd and B Ltd. Now we are starting common size income statement analysis on following basis.
1st Base of Analysis : Comparison of Gross Profit
We will make Pie chart of A Ltd and B Ltd by taking its % sales, % cost of goods sold.

1st Base of Analysis : Comparison of Gross Profit
We will make Pie chart of A Ltd and B Ltd by taking its % sales, % cost of goods sold.

By seeing its pie chart, it is clear that A Ltd has manage better its cost of sales. Due to this, its gross profit is more than B Ltd. B Ltd should adopt the techniques of controlling cost of sales of A Ltd. Cost of sales' main factors are purchase, direct expenses and closing stock. If B Ltd will buy good quality material at minimum cost and try to decrease its direct expenses, its gross profit will surely increase.
2nd Base of Analysis : Comparison of Operating Expenses
When we compare two companies on the basis of common size income statement, we also check their operating expenses. In operating expenses, we include office and selling expenses. Both companies total operating expenses is 10%. So, we can not take the decision which company has better for saving operating expenses.
3rd Base of Analysis : Non - Operating Expenses
In non-operating expenses, we include interest expenses, deferred expenses written off. Company B Ltd's non operating expenses are less than company A Ltd. But, we also do not forget that this is just on the basis of sales proportion. We are just estimating that our sales which is our total revenue, is sufficient to pay all operating and non operating expenses. In B Ltd case, it has good because it is less than A Ltd.
4th Base of Analysis : Net Profit
Net Profit % of A Ltd and B Ltd will show clear picture of performance of A and B. A Ltd earned 24% net profit and B Ltd earned 15% net profit. From this, we can tell the result that A company's overall profitability is good than B Ltd.
STEPS TO ANALYZE FINANCIAL STATEMENTS:
Financial statement analysis can be used for many purpose in business. With this analysis, management can take decision regarding more investment in inventory by buying or making it or other decisions like investment in different fixed assets. If financial statement analysis shows the low amount of fund for operation, at that time, company can take decision of issuing new share capital or managing of new bank loan. by Simple comparison of past items of financial statements with the current items, we can analyze the profitability, solvency, liquidity and stability of company. Comparative income statement, comparative balance sheet and ratio analysis are the main tools of analyzing financial statement.
Steps to analyze financial statement
1st Step : Calculate the Different Ratio of past and current years:
Suppose, you want to check profitability of company. At that time, you will calculate gross profit ratio, operating cost ratio and net profit ratio of both current year and previous year.
Current year gross profit ratio = 185000/800000 X 100 = 23.13%
Previous year gross profit ratio = 105000/700000 X 100 = 15%
Current year operating cost ratio = 36000/800000 X 100 = 4.56%
Previous Year operating cost ratio = 35700/700000 X 100= 5.10%
Current year net profit ratio = 154610/800000 X 100= 19.32
Previous year net profit ratio = 68750/700000 X 100 = 9.82%
2nd Step : Interpretation of Facts
It is the important step of analyzing of financial statement. In this step, we explain facts in simple words, from above ratio, we can explain that gross profitability of company has improved because it increased from 15% and reached at 23.13%.
Company has also succeeded to reduce his operating cost. It decreased because previous year operating cost was 5.10% but this year, it is just 4.56% and its result, we are seeing that net profitability of company has reached up to 19.32% of total sale.
Note : This just one example in which we have checked the profitability position of company and same way we can also check solvency position of company by calculating debt equity ratio or other ratios. Solvency means power of company to pay his all long term debts and other liabilities. Suppose if debt equity ratio is 1: 4, it means company is more solvent because company's shareholder fund is 4 and debt is just , so, debt can easily be paid anytime.
LIMITATIONS OF FINANCIAL STATEMENT ANALYSIS:
Following of main limitations of financial statement analysis :
1. It is just study of interim reports.
2. It check just monetary aspect of company's performance and position but it ignores non-monetary aspect of company.
3. It does not analyze the changes in price level of different items of financial statements.
4. Many accounting concepts and conventions are used for preparing financial statement and these concepts and conventions are accepted for analysis. So, analysis is totally affected with these accounting concepts.
5. Analysis of financial statements are just source but not decision or result because person who write its interpretation, may also affect the analysis. So, different interpretation by different person may become its limitation.
6. LIFO vs FIFO and different depreciation methods usage may bring difference in result and performance of financial statement, so it is also limitation of financial statement analysis.
7. If one company's accounting period completes at 31st Dec. and other company's accounting period completes at 31st march, we will unable to compare both company's financial statement and it will be the limitation of financial statement analysis.
TREND ANALYSIS:
In management accounting, trend analysis is the part of financial statement analysis. It means, to take one financial item and its all past years figures. By taking first year as base year, we calculate % figure of each year. Now, it becomes trend. On this trend, we analyze its spreading flow. It may be upward or downward. With this, we can analyze our past performance and financial position growth.
With analysis, we can estimate future values and uncertain events in any past years. In above years, I have taken 10 years sales and calculated its trend by taking year 2000 as base year. With this sale trend, you can analyze which year, your sales increased and which year it decreased.
It is just sample, you can also calculate the trend of current assets, current liabilities, cost of goods sold, gross profit and net profit.
Financial analysis is really important in a company every year. I have learnt tips from Aloke Ghosh like how to manage financial data and then how we can calculate financial analysis of a company.
ReplyDelete